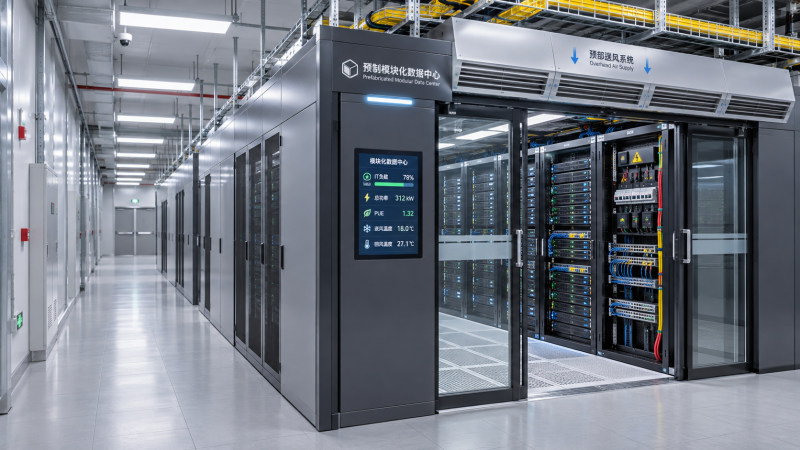
Related Industries
Curation by industry experts
Hot Articles
Popular Tags
How to estimate the IT capacity a prefabricated data center needs
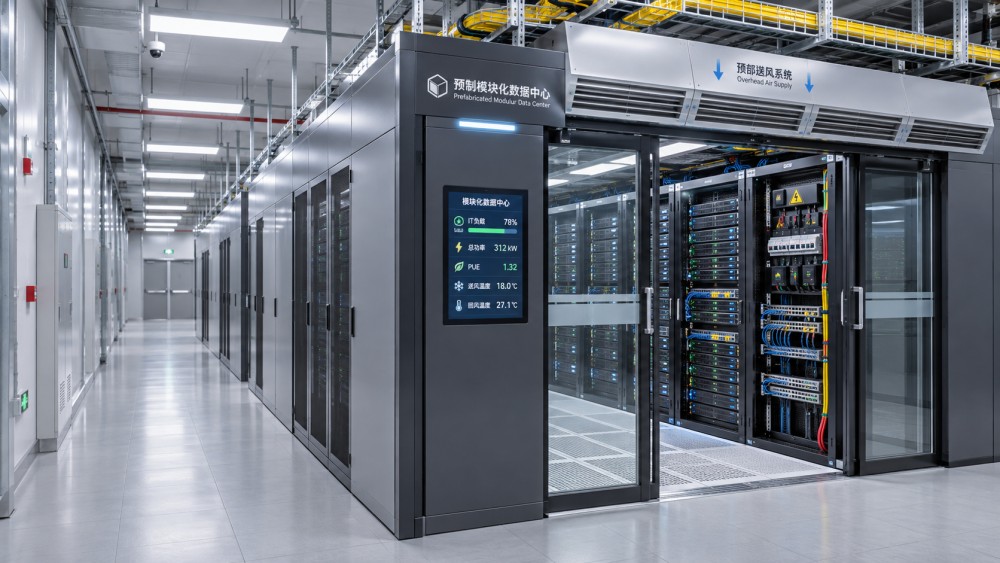
Estimating prefabricated data center IT capacity requires more than multiplying rack count by a nameplate power rating. A module may have enough physical rack positions but insufficient power for the equipment planned, or enough electrical capacity but not the cooling infrastructure to remove its heat. For a technical evaluator, the task is to identify the usable IT load the complete installation can support under the intended workload, operating conditions, and failure scenarios.
A practical estimate starts with the equipment and works outward: from servers and storage to racks, electrical distribution, cooling, and the site connection. It should also distinguish the capacity needed on day one from capacity that must be available after expansion. The following method provides a basis for comparing prefabricated solutions without mistaking an attractive headline rating for deployable compute capacity.
Define what the capacity figure actually measures
Before calculating demand, establish a common boundary for every figure in the evaluation. Suppliers may describe a module by its IT load, total facility demand, rack count, cooling capacity, or a utility connection requirement. These are related, but they are not interchangeable.
- IT load: Electrical power consumed by computing, storage, network, and other IT equipment within the agreed measurement boundary.
- Facility demand: IT load plus cooling, power conversion losses, controls, lighting, and other supporting loads within the facility boundary.
- Rack density: Power assigned to an individual rack, usually expressed in kilowatts per rack. A facility average does not establish what every rack can support.
- Usable capacity: The IT load the installed system can sustain under specified conditions, including any required maintenance or equipment-failure scenario.
Power usage effectiveness, or PUE, expresses total facility energy divided by IT energy over a defined period. It can inform an early site-power estimate, but a projected PUE is not proof that a particular electrical path or cooling system can support the design peak. Ask for its assumed operating load, climate, measurement boundary, and period before using it in a comparison.
Build the IT load from the equipment up
Create an equipment schedule for each deployment phase. Include servers, accelerators, storage, network switches, security appliances, and other devices that will draw power from the IT distribution system. Record quantities, planned rack locations, power-supply configuration, and the expected operating profile.
For each equipment group, estimate a credible simultaneous peak demand. Manufacturer configuration tools, measured data from comparable installations, and workload tests are generally more useful than assuming that every power supply draws its full nameplate rating continuously. Equally, average utilization is not a safe substitute for a design peak. Where evidence is incomplete, retain the nameplate-based estimate as a conservative scenario and identify what testing could narrow the range.
Baseline coincident IT demand = sum of the expected simultaneous peak power of all IT equipment groups.
The word “simultaneous” matters. A storage system, network fabric, and accelerator cluster may not all reach their individual maxima at the same time, but any diversity assumption needs a defensible workload basis. Avoid applying a generic diversity discount simply to make the numbers fit. Consider startup, failover, workload migration, and recovery events as well as normal operation.
Then add an explicit allowance for growth and uncertainty. Keep the two visible: planned equipment additions are not the same as a contingency for incomplete specifications. The resulting figure is the target IT design load to test against supplier proposals; it is not automatically the utility connection size.
Translate the total into a rack-by-rack plan
A total IT capacity figure can conceal a local constraint. For example, a module rated for 200 kW of IT load may contain 20 rack positions, giving a simple average of 10 kW per rack. That average does not establish whether any position can support a 30 kW rack, whether several such racks can be adjacent, or whether enough power and cooling are available concurrently.
Develop a rack schedule that shows the expected peak kW for each populated position, the equipment type, and the cooling method. Mark high-density racks separately from lower-density storage or network racks. For accelerated computing, check the actual server configuration and workload: training and inference deployments can differ in utilization, network requirements, and heat distribution.
Ask suppliers to identify both the maximum supported rack density and the distribution rules behind it. A statement such as “up to 30 kW per rack” should be accompanied by the number and location of racks that can operate at that level at the same time. Check rack dimensions, equipment access, floor or module structural loading, cable routes, and clearances alongside power and cooling.
Test the estimate against electrical capacity
Trace the power path from the available site supply to the equipment: connection, transformers where applicable, switchgear, UPS, distribution boards or busways, rack power distribution units, and server power supplies. Each element can constrain the usable IT load. A module’s electrical rating also depends on voltage, configuration, ambient conditions, and the supplier’s stated design basis.
Redundancy requires particular care. N+1 generally means an additional component is available beyond the number required for the design load, but the actual arrangement and failure assumptions matter. A dual-corded server is not automatically protected against every upstream failure. Review whether each path, component group, and transfer arrangement can carry the required load when a specified element is unavailable or under maintenance.
For example, two rack power feeds normally sharing a 12 kW load must each be assessed for the full transferred load if either feed is expected to sustain the rack alone. Confirm circuit ratings, continuous-load and derating requirements, protection coordination, and the applicable electrical code with the project engineers. Do not simply add A-side and B-side ratings together and call the result usable redundant capacity.
At the site boundary, distinguish an announced or reserved utility allocation from a connected, commissioned supply. A prefabricated module can arrive before upstream transformers, switchgear, backup systems, or the utility connection are ready. Capacity that exists on a specification sheet is not yet capacity available to run a workload.
Check whether cooling can remove the same load
Nearly all electrical power consumed by IT equipment becomes heat that the facility must ultimately reject. The cooling design therefore needs to support the IT load and any relevant additional heat loads under the agreed operating conditions. A nominal cooling figure alone is not enough: performance depends on factors such as entering air or water temperatures, flow rates, outdoor conditions, and redundancy.
For air-cooled equipment, review airflow paths, containment, supply and return temperatures, and the risk of hot-air recirculation. A module may meet its total cooling target while struggling with a concentrated hot spot. Verify that the proposed arrangement supports the planned rack distribution rather than an idealized uniform load.
For direct-to-chip liquid cooling, establish the interface between the IT equipment, coolant distribution units, facility water system, and heat rejection equipment. Confirm coolant compatibility, water quality, available temperature and flow, controls, leak detection, and service access. Direct-to-chip cooling may remove only part of the server heat; the remainder still needs an air-cooling path. The relevant split must come from the equipment configuration, not an assumed industry average.
Include the same failure and maintenance assumptions used for power. If an N+1 cooling arrangement is required, ask what IT load remains supportable with the specified cooling component out of service, and for how long any transient conditions are acceptable.
A worked estimate: from workload to facility demand
Consider an illustrative deployment with a coincident peak demand of 160 kW across its planned IT equipment. The team identifies another 24 kW of specific equipment additions and reserves 16 kW for remaining uncertainty. Its initial selection target is therefore 200 kW of IT design load, subject to refinement as equipment and workload data improve.
Suppose an early planning model assumes a PUE of 1.30 at the relevant operating load. Multiplying 200 kW by 1.30 gives an indicative facility demand of 260 kW. This is a screening estimate, not a final utility or generator specification: actual demand and losses depend on the equipment, operating point, boundary, and design conditions. Starting currents, backup arrangements, local requirements, and future phases still need engineering review.
The rack schedule then reveals that four of the planned racks require 25 kW each, while the remainder have lower loads. A 200 kW module is only a candidate if it can support those four high-density positions concurrently, distribute power to them with the required resilience, and reject their heat under the specified conditions. If it cannot, the team may need a different rack layout, a higher-density cooling configuration, additional modules, or a revised deployment plan.
Compare proposals on the same operating basis
When quotations arrive, request a capacity schedule rather than relying on a single brochure figure. The most useful comparison shows what is included, what must be supplied by the site, and what remains available during a defined failure or maintenance event.
Delivery time and purchase price are only part of the decision. Installation, integration, testing, maintenance access, consumables, staff training, and service response can materially change the practical value of a proposal. If a quoted module excludes heat rejection or upstream electrical equipment, include those dependencies when comparing it with a more complete scope.
Leave a clear route from estimate to acceptance
The capacity estimate should become a controlled project document, not a number copied once into a purchase order. Record the workload assumptions, equipment list, rack schedule, growth allowance, operating conditions, and required failure scenarios. Flag unresolved inputs and assign responsibility for closing them before design freeze.
Before acceptance, agree how the installed solution will demonstrate its capacity. Tests may include electrical distribution checks, load-bank testing, cooling performance at agreed conditions, controls verification, and simulated component failures where safely achievable. A factory test can establish important evidence, but site testing is needed to assess interfaces with the actual power supply, heat rejection, and building systems.
The right prefabricated data center IT capacity is ultimately the load the complete installation can support—not merely the largest figure in a proposal. A transparent estimate makes trade-offs visible early, gives suppliers a consistent basis for their offers, and helps the project team understand what must be ready before the first workload goes live.
Questions about data center smoke detection standards? Contact RackLedger for further insights.
We respect your privacy. Your information is strictly confidential.
Recommended News
 How to estimate the IT capacity a prefabricated data center needsEstimate prefabricated data center IT capacity with a practical guide to rack density, power, cooling, redundancy, and growth. Compare solutions with confidence.Nov 04, 2026
 Server CPUs Explained: Cores, Clock Speed and Memory BandwidthServer CPUs explained: discover how cores, clock speed and memory bandwidth affect performance, and learn how to choose the right processor for your workload.Nov 04, 2026
 Network Interface Cards: When Does a Server Need 25GbE or 100GbE?Network Interface Cards: Discover when 25GbE is enough or 100GbE pays off, and check workloads, compatibility and costs before upgrading.Nov 04, 2026
 Rack Servers Explained: How They Fit into Data Center InfrastructureRack servers are key to data center infrastructure. Explore power, cooling, networking, and space requirements to plan a reliable deployment.Nov 04, 2026